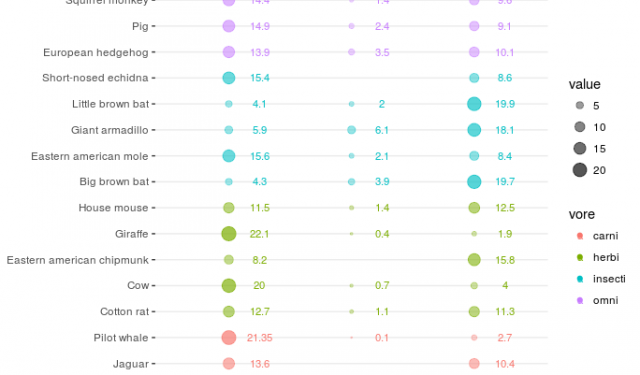
Heat maps are great to compare observations with lots of variables (which must be comparable in terms of unit, domain, etc.). In some cases however, traditional heat maps might not suffice, for example when you want to compare multiple groups of observations. One solution is to use facets. Another solution, which I want to explain here, is to make a “ballon plot” with a fixed grid of rows and columns.
Parallel Coordinate Plots for Discrete and Categorical Data in R — A Comparison
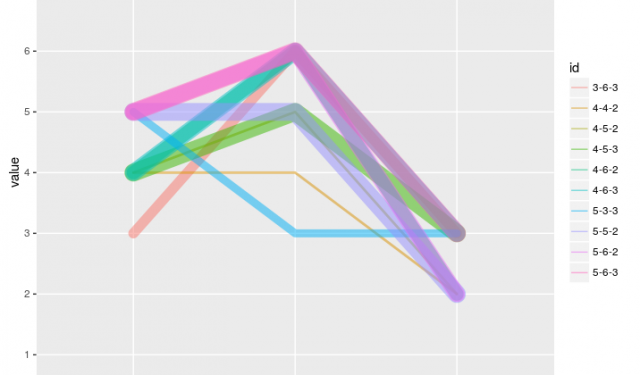
Parallel Coordinate Plots are useful to visualize multivariate data. R provides several packages/functions to draw Parallel Coordinate Plots (PCPs):
- ggparcoord in the package GGally
- the package ggparallel
- plain ggplot2 with geom_path
In this post I will compare these approaches using a randomly generated data set with three discrete variables.
Bringing SVG to life with d3.js

Scalable Vector Graphics (SVG) are create to display high quality, scalable, graphics on the web. Most graphics software like Adobe Illustrator or Inkscape can export it. The graphics are of course static, but with a little help from the JavaScript data visualization library d3.js, they can be brought to life by animating parts of them or making some elements respond to actions like mouse clicks.
In this post I will explain how to do that using the example of an interactive map for the LATINNO project.
Recent Comments